How high is your booth bounce rate? Measure it.
 Greyson Joralemon
Most exhibitors don’t know it. Ones booth bounce rate is still an unknown metric for most marketeers and event managers. And we can’t blame them. How would you know it if you don’t measure the performance of your booth to begin with?
To demonstrate how important your booth bounce rate is, let’s take a look at what it means, and how you can simply calculate it.
Bounce rate: web analytics vs. trade shows
In the field of marketing, the bounce rate is a metric that is well known for websites. For the web, the bounce rate is defined as following:
A bounce is a single-page session on your site. In Analytics, a bounce is calculated specifically as a session that triggers only a single request to the Analytics server, such as when a user opens a single page on your site and then exits without triggering any other requests to the Analytics server during that session. [source]
This means that for a website, the bounce rate is a key number to measure the effectiveness of a given website. It reflects the site’s capacity to convert a single passing visitor into an engaged visitor who will browse further through the site.
The exact same is true for your booth at a trade show. All visitors passing in the proximity of your booth are the equivalent of a single request – a hit. And your booth bounce rate is the performance rate (measured in percent of visits) of your booth at converting passing visitors into engaged ones.
Calculate your booth bounce rate
On trade shows or conventions you need two main measurements to calculate the effective bounce rate of your booth:
- the Passing visitor count (equal to the Total visitors count – Engaged visitors)
- Total visitor count
Also, to qualify a passing visitor as a bounce, we should exclude from our passing visitor count all returning visitors (only applicable for multiple day events) that may have been returning on site. This of course is optional and will definitely play in favor of your bounce rate and lower it. This is nevertheless the right way to approach it as a returning visitor (engaged or not) is the equivalent of a second hit/view on your booth.
Let’s use the following example to illustrate:
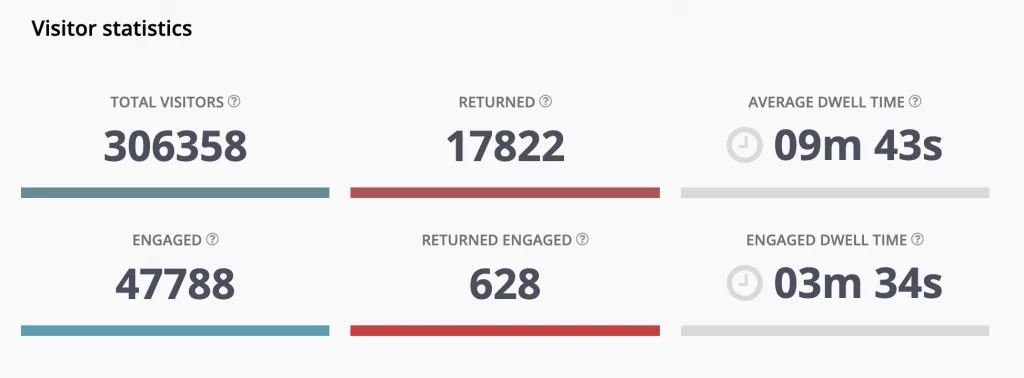
Screenshot from the Event Analytics summary page
Visitor count = Total visitors – Engaged – (Returned – Returned Engaged) = 306358 – 47788 – (17822-628) = 241376
Bounce rate = Visitor count / Total visitors = 241376/306358 = 0.7878 = 78.8% bounce
Note: the returned count will vary depending how your data includes returned engaged.
Bounce rate vs. Conversion ratio (Macro vs Macro)
In another post on “4 way to increase your conversion ratio on trade shows” we talk about conversion ratios. And, how these can be improved by converting more passing visitors into engaged visitors throughout a show.
While both metrics are clear indicators of performance, it’s important to not consider them as equals.
- Bounce rate: this metric represents your overall performance in retaining visitors at first sight. It’s ideal to quickly judge your overall booth performance.
- Conversion ratio: at a more micro-level (a specific location), the conversion ratio specifically measures the percentage of passing visitor that became engaged ones. It is ideal to monitor the effectiveness of a specific demo or product appeal.
Your turn
Now it’s your turn. Take a look at your booth statistics and play the game. Start from your current baseline and look at ways to improve your bounce rate. Always keep in mind that the success of a show lies within the engagement of a maximal audience.
Illustration by Greyson Joralemon
 Ruthson Zimmerman
 Eugene Chystiakov
 Ian Schneider
 Louis Reed
 Event Analytics
 NeONBRAND