Brand activations, experiential marketing metrics that matter
 Kirk Morales
With the rise of experiential marketing, outdoor activations on the streets, in malls and festivals is at an all time high. Consumer shift of purchasing habits to online created a huge opportunity for brands to take over spaces and deliver meaningful brand experiences. These experiences are unique, temporary and sometimes part of sophisticated marketing roadshows nationwide.
But the real world is nothing like online. Conventional wisdom tells us that it can’t be measured – but this is far from the truth. Today’s technology helps brands, agencies and event managers to accurately measure footfall at activations. Quantify the dwell time of visitors (time spent), engagement and even measure visitor demographics. True Experiential Analytics.
Here are the three metrics that matter most for experiential marketers:
Visitor count
Not just visitor count, better, unique visitor count. This count is by far the best number to use to represent the success of an experiential activation. This number resonates with brand managers and top management. It accounts for all unique visitors that pass-by and may engage at some point with the activation.
At Event Analytics, we make the distinction between two types of visitors :
- Passing visitors: over a wide distance surrounding your experience. This counter includes every single individual who has taken part to your activity, or who may just have seen it from afar.
- Engaged visitors: over a much narrower distance, closer to your experience. Engaged visitors have been in close proximity to your activation. They also spend a minimum amount of time there to qualify as engaged (you decide what time is right).
Formula
Visitor count = Passing visitors + Engaged visitors
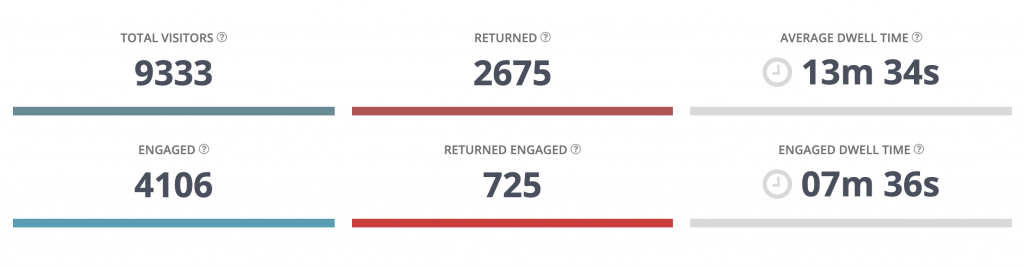
View from the Event Analytics Dashboard – Experiential Analytics
This number is available in near-realtime throughout your activation, and shows up first at the top of your Event Analytics dashboard.
Visitor engagement and dwell time
Beyond measuring brand visibility, engaging visitors at an activation is key. That being said, visitors decide to spend more or less time at a space – and the duration of their visit is another key indicator of success. The technical term for this is Dwell Time. In addition to being a metric of success on its own, dwell time can be visualized in segments – a cue to how visitors behave at your activation.
Is it 30 seconds, 1 and 2 minutes or more than 5 minutes? We can tell you precisely.
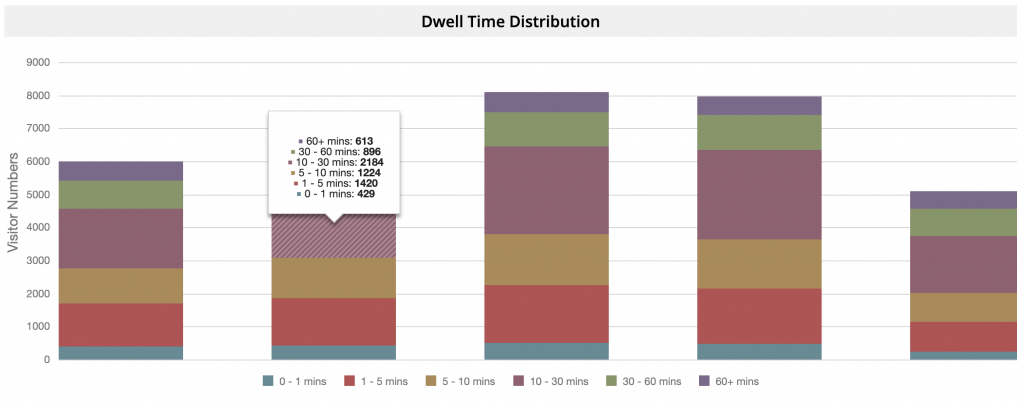
Experiential analytics – Dwell time distribution
You can then use these numbers to optimize for:
- a higher throughput – shorten the time of your activity and increase capacity
- a better delivery of your message – effectively deliver your experience and message within the time most visitors have. (hint: staff training)
Smart!
Brand-reach
Finally Brand-Reach. Brand-reach is a measure of the total time of exposure recorded by your brand at an event. Expressed in days / hours / minutes, this is your go-to metric to effectively compare success accross activations. Brand managers and agencies use this metric a lot on road-shows.
Formula
Brand-reach = Total visitor count x Average visitor dwell time
Some uses of brand-reach:
- Compare event to event reach performance
- Assess changes and impact from tests implemented at events
- Evaluate the impact of hired influencers
- Use this metric along-side minutes-watched from content reach. Ideal for multi-platform campaigns that mix online and offline.
Similar to brand-reach, we also measure engagement-reach. This other valuable metric is specific to the measurement of reach from engagements. Both metrics together make up the ideal combo to evaluate your next brand activation.
Illustration by: Kirk Morales
 Ruthson Zimmerman
 jose-carbajal
 Louis Reed
 Element5 Digital
 Perry Grone
 Greyson Joralemon
 Event Analytics
 Ian Schneider