Best Event Analytics technology we use in 2019
 Ruthson Zimmerman
From inception, we aimed to be a firm not bound to a specific analytics technology. Instead of developing our own technology, we focused on service and consultancy to help event managers and agencies gain insights and uncover the true value of their events.
Our founders knew that picking a side would ultimately be a disadvantage for our customers. In the real world, making analytics technology work for events can be a challenge. Each context, each event, each location is different. Since there might never be a one-size-fit-all technology for solving these challenges, we believe that vetting existing technologies and provide selection expertise is where we can truly add value.
Nobody want’s to hunt down the right suppliers. But everyone wants a trusted solution provider.
To provide world-class analytics services to our clients, we constantly test and research new technologies. We build partnerships with great technology companies and work out the best ways to use their tech in our customers’ context. We complete the technology choice with our team’s expertise to provide customized business insights for our clients.
But enough talking! Let’s take a look at some of the technologies we use and recommend most.
Wi-Fi analytics technology
Wi-Fi-beacon or Wi-Fi analytics is a technology that uses Wi-Fi signal to generate analytics. More specifically, Wi-Fi analytics technology is about listening for network probes from cellphones. We listen to these, count and measure how long the signal is in range. This is done without interaction or personally identifiable information being given up by the end-user.
When combined, these measurements, allow us to tell:
- How many people are in an area
- Know how long a person was present
- Tell how close a visitor was to a point-of-interest
- Learn if a person is within the engaged perimeter, or simply passing afar with set of rules & “presets”
This technology is fairly cost effective and, when calibrated well, also accurate. This is our most-used technology to date. It is practical, flexible and accurate, thus making it a great all-rounder.
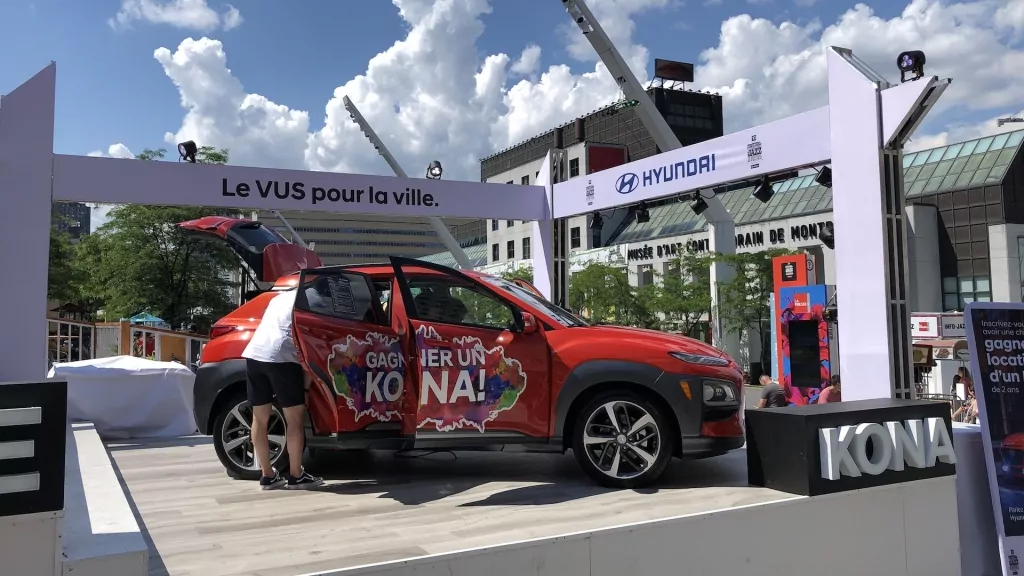
Wi-Fi Analytics technology measures ROI of an outdoor activation at a festival
We use Wi-Fi Analytics in the context of B2B shows and B2C expos. We use it for indoor and/or outdoor brand activations such as popup stores or marketing stunts.
Bonus: connectivity at events is still not 100% guaranteed. So all our Wifi analytics sensors come equipped with their own 4G connectivity, and integrated battery packs.
Bluetooth analytics technology
Bluetooth-beacon or bluetooth analytics is similar to it’s Wi-Fi analytics counterpart. Instead of listening to Wi-Fi probes from smartphones, we are looking at those made via the Bluetooth technology. Today, bluetooth devices are relatively more discrete than Wifi and are not always discoverable without an interaction. This makes the tech not reliable enough to count people through their smartphones.
That being said, Bluetooth analytics technology works extremely well when used in combination with additional trackers. These little trackers, the size of a watch, can be incorporated in wristbands, badge lanyards and badges themselves. Coupled with on-location sensing equipment, they allow for a very precise tracking of visitors. Assuming everyone is wearing the tracker.
These additional devices people wear allow us to tell:
- All of what Wi-Fi analytics can,
but also add in some cases, cool additions such as:
- Record interactions between participants (usually, contact exchanges)
- Send targeted messages (via App or SMS) to participants linked to a tracker that is detected to be at a specific point-of-interest.
- Power LED lights, sync effects, etc.
Wearable bluetooth technology used at B2B events for analytics
We use Bluetooth Analytics in the context of B2B events exclusively such as conferences or trade-shows. The solution, with all the possible add-ons, is generally more expensive than Wifi analytics. It is also more intrusive as it requires every visitor to wear a tracker.
Face detection analytics technology
Face detection is by far the most hyped analytics technology at the moment. In this space, there are literally hundreds if not thousands of companies developing technology, training machine-learning algorithm and so called “AI”, to be the best and most accurate at doing it.
Face detection isn’t anything new. Researchers years ago published free and open source libraries such as OpenCV that can do face detection with excellent accuracy. But with recent news like China’s social scoring system, and some abusive uses made of the technology, consumers are fearful that behind every CCTV camera there could be a sophisticated tracking system in place.
Face detection vs. Face recognition
Everyone can make their own opinion about the technology. While it can only be as good as what people will do with it, it’s important to understand the difference between face detection and face recognition.
Face detection allows to:
- Count faces
- Track eye contacts (count and measure the eye contact connection)
- Detect if the face is female or male
- Give an evaluation of the face’s age group (0-10, 10-20, 20-35, 35-55, etc.)
- Provide other element such as if the face has glasses on, if the face has a beard, etc.
- Provide an evaluation of the mood (sad, happy, neutral, angry, …)
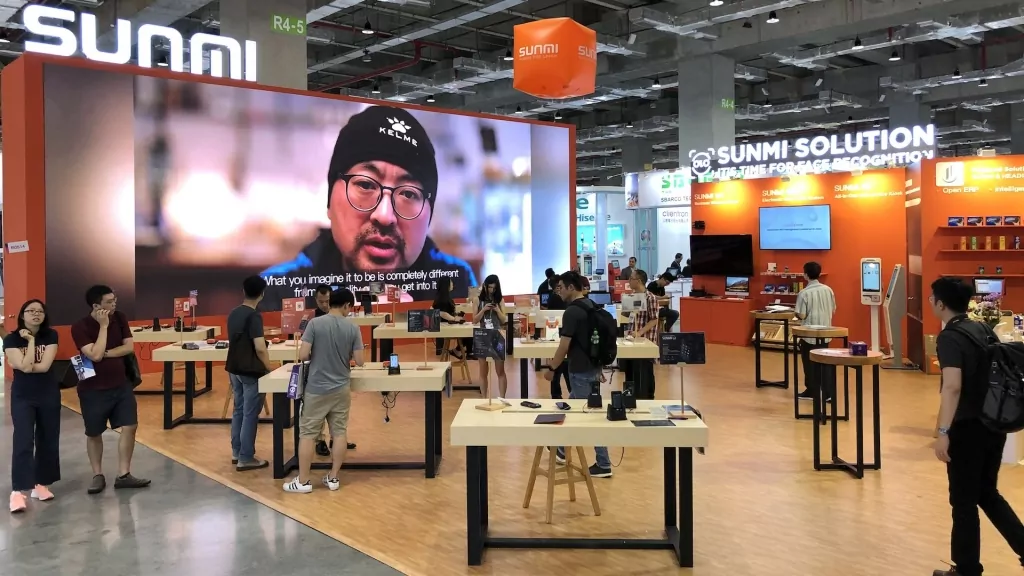
At Event Analytics, we mostly use face detection to provide our clients with the following insights:
- Are people looking at screens / products?
- How long are people looking at them?
- Statistical information on demographics (statistical personas)
Note: Face detection can count the number of detected faces but will not count towards unique (distinguishable) faces (cf. personally identifiable data via face geometry). For this reason, it is not the right technology to use to count visitors.
Face detection technology use to measure visitor demographics and product interest.
On the other side, face recognition is much more powerful and can be used to identify people from the geometry of their face.
Face recognition allows for:
- Counting unique visitors
- Identifying the same visitors across multiple angles, and identify returning visitors
- Detecting VIPs (if profile images are fed to the system upfront)
- or, detecting people on a blacklist.
You will probably immediately see the possible abuses made from face recognition systems. And so, it’s extremely important to be very cautious on how the technology is used, and for what purpose. With GDPR, face recognition is not usable at this time on most trade shows.
No matter what, we always recommend our clients using camera-based technology to simply disclose the use and purpose to visitors through signage.
Floor sensor analytics technology
Floor sensor analytics technology works with sensors placed under the floor. This fully anonymous solution allows to sense visitors walking around a space, or stepping in certain areas.
With over 60 sensing units per square foot, these are extremely precise. These sensors allow us to:
- Count visitors
- Follow their path / journey precisely (much more precisely than Wi-Fi / Bluetooth analytics)
- Measure waiting lines
- Trigger location sensitive actions via APIs (exhibit houses, this is for you! – cf. Experience Design)
Use of sensor technology to precisely map visitor journey and trigger interactivity
We use floor sensor analytics for locations where radio-wave (wifi / bluetooth) detection isn’t possible. It’s also our go-to solution when interactivity is part of our clients strategy to improve the experiential activities they offer.
One of the inconvenient though is installation. It is a little more complex than other solutions.
Over-the-door sensor analytics technology
Finally, our last analytics technology of choice is that of over-the-door sensors. These sensors most often use lasers (not the red one, but an invisible one) to measure the distance between the sensor and objects that pass through doors in and out.
With these we can measure:
- How many people are in a room – at 99.9% accuracy – without any tracker
- Know how many visitors are present per segments of time (hour, days, month)
- How many visitors get to visit certain spaces

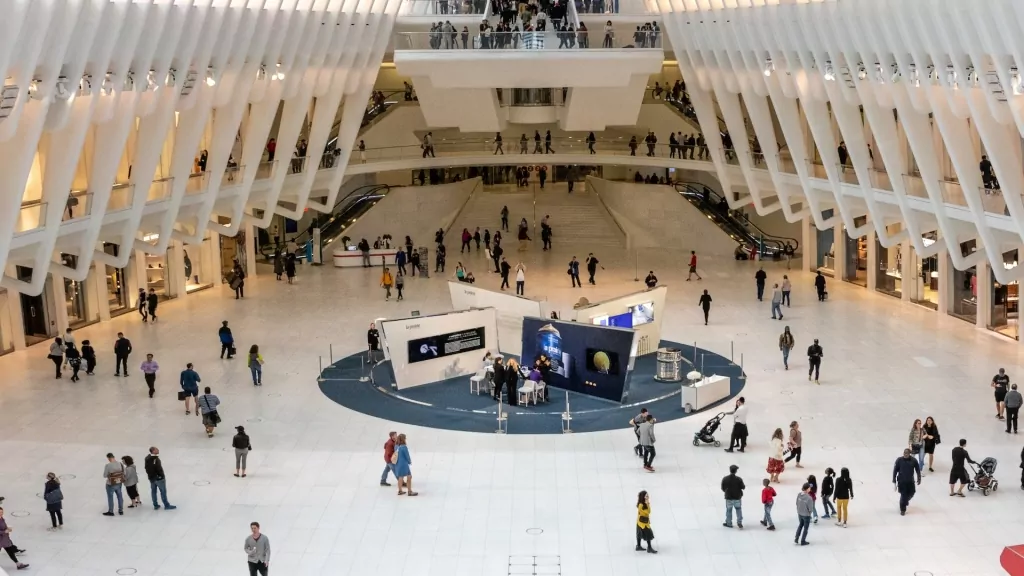
Use of over the door sensors to measure venue attendance and visitor capacity
We use over the door sensor analytics to measure precise footfall of enclosed spaces. It’s an ideal analytics technology for short and long-term installations such as exhibitions, popup stores and spaces with multiple rooms for visitors to visit.
In addition, these sensors can be useful when compliance to fire marshal set room capacity is required (small venues, bars, clubs, etc.).
Got questions?
We hope that this article was helpful. It’s always a pleasure to share our views on the various technology options we work with. If you have questions with regards to a specific technology or some of our services such as: installations, analytics and consultancy – please contact us!
Photo by Ruthson Zimmerman

 Event Analytics
 jose-carbajal
 Louis Reed
 Greyson Joralemon
 Ian Schneider
 Perry Grone